A Word on Ratios:
Please remember that Tax is an important element but as this varies so significantly from individual to individual this cannot be used in our examples and excluding it will give you a good idea of your options prior to your personal tax considerations.
Different people use different methods of calculating these Ratio’s and Yields. In some businesses, interest payments are excluded in certain cases from the income (increasing income on the whole). Nonetheless, we recommend these ratios as being a great comparison tool for landlords.
Gross Yield
Consider all of your outgoings as a result of your investment. Look at the whole picture. This is the most commonly used means of assessing your portfolio, but is also the least useful. Typically ‘Annual Rental Income’ does not account for voids or deductions and often the Cost of the Investment excludes any transactions costs (though it shouldn’t). As a basic analysis of whether property is a reasonable rental proposition or not, it is a decent tool, but beyond that it fails to account for any other important aspects of performance evaluation. Net Yield is a much better tool.

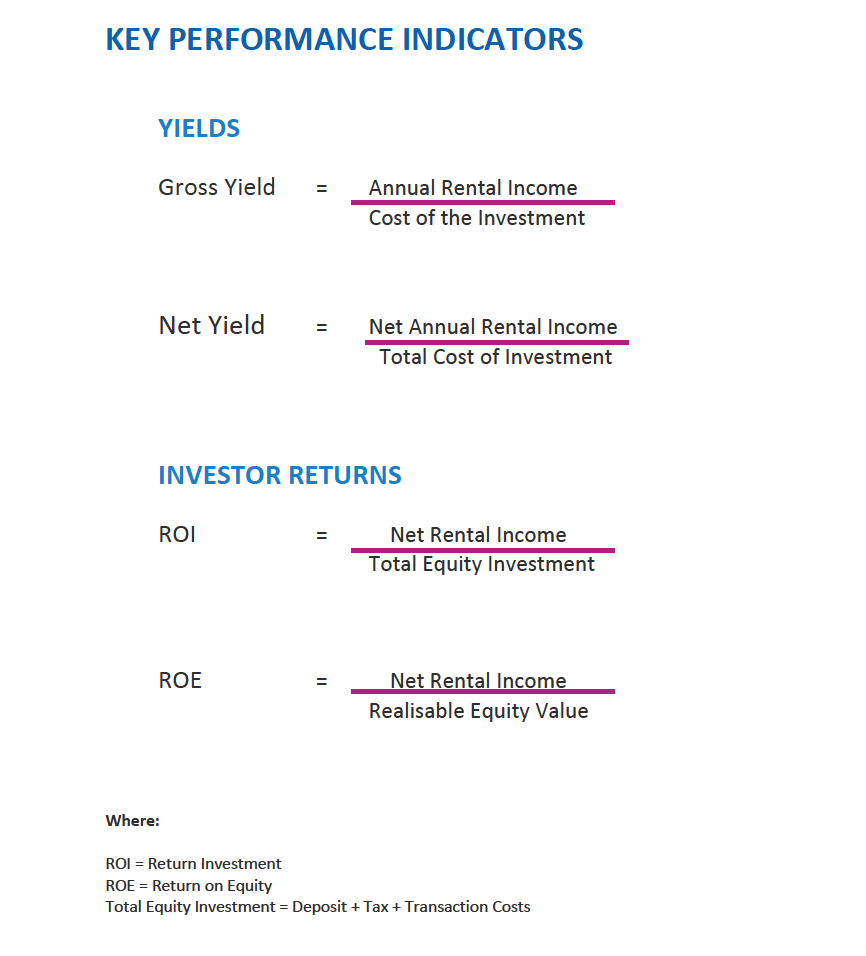
Net Yield
Net Yield is the most relevant assessment of how much income your investment is generating. The ratio used Net Rental Income which is after deductions for all costs and void periods. The Total Cost of Investment is also used, including all transactions costs. This measure will determine precisely how well the investment is performing in terms of what impact it will have on your pocket. All too often this is ignored.
Our calculation excludes tax as it varies by landlord.

Return On Investment (ROI)
Determines the rate of return you are earning but as a function of your cash outlay for the investment. It does not include debt, only equity invested so only your personal costs (incl tax) and personal funds. It is thus a lower sum than the Cost of Investment unless the asset was bought in cash only. This is a great tool to assess how your investment has compared to other alternatives prior to making the investment. An example would be a comparison to an investment in a bond. The comparison uses a current return and a historic cost so it does not compare your alternatives today (see ROE). Comparison using ROI will help identify and compare performance against previous options.
Return On Equity
Considering putting your money elsewhere? You need to compare your options using this method which is similar to ROI but replaces Total Equity Investment with the Realisable Equity Value of Investment.
Realisable Equity Value of an Investment is what you will end up with in your pocket following a disposal (excl. tax in our model) so looks at current value and takes account of costs of sale and any other transactions costs. By calculating the ROE you are able to gain a comparison with other forms of investment at today’s prices so it is a useful tool to assist you with capital allocation.
Don’t rely on any one ratio! Understand the benefits and drawbacks of each option.
- ADDING CAPITAL GROWTH
(1) Capital Growth
The chances are your property, if held for long enough will increase in value so it is important that you assess this impact on your performance. This is affected by House Price Inflation.
The level of debt you have here can have a significant impact. High debt ratios (high gearing) implies you will benefit more from increases in House values as there is no corresponding increase in the value of your debt.
(2) Compounded Annual Rate of Return
Adding the growth in the value of the capital to the net income generated by the capital will give you an overall impression of how your investment is performing or how you expect it to perform. This takes the value of the cashflows generated by the property and adds it to the equity value and expresses it as an annual rate of growth based on your initial investment or your current